- Grant spending per researcher
UK data is taken from the Research Assessment Exercize (RAE2008, http://www.rae.ac.uk/results/). The total UK research council (RC) funding by grants to universities by discipline,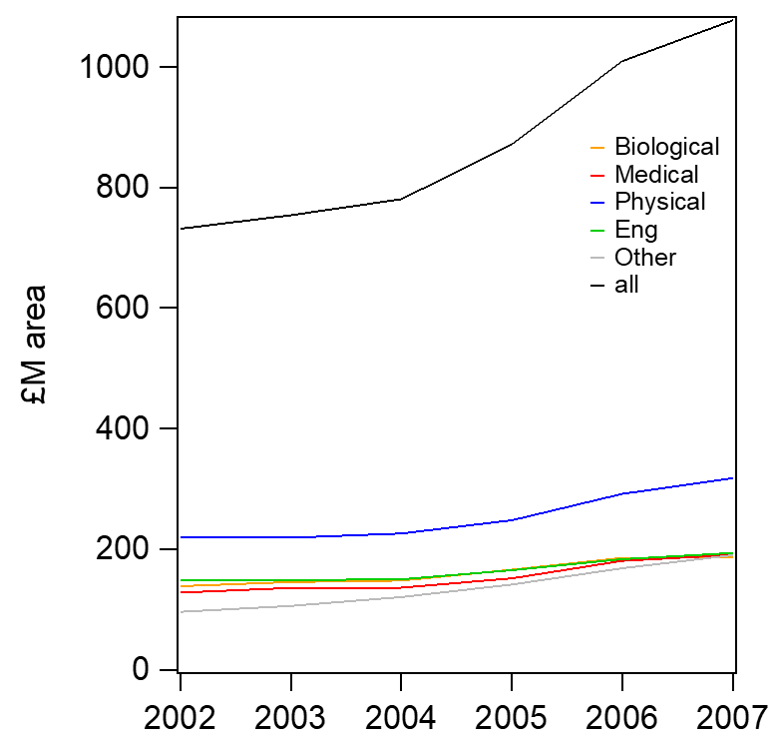 is broken down by gross fields, showing roughly even splits with more for physical sciences.This is about a third of the total income to universities (other funding comes from industry, government departments, the EU, and separate infrastructure funding). Grant funding increased at about 10%/year for all disciplines before 2008.
Spending per researcher in different disciplines can then be extracted: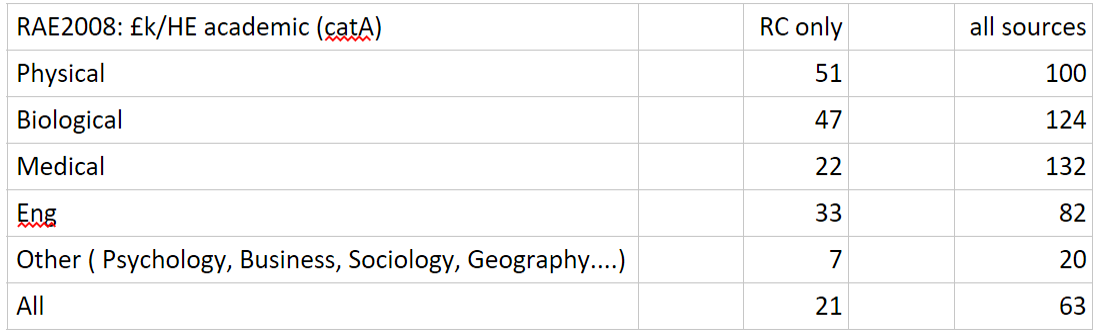 which shows variation from the research councils (RCs) of £22-51k/year per higher education (HE) academic.
- OECD data
This data was downloaded from the OECD and UNESCO websites. OECD data is more detailed, but covers fewer countries while UNESCO covers other countries but in less detail. I use GERD (Gross Expenditure on R&D in a country), BERD (Business fraction), with figures from http://www.esds.ac.uk/international/support/user_guides/oecd/sti.asp, and http://www.oecd.org/statsportal/0,2639,en_2825_293564_1_1_1_1_1,00.html. Note that the new Frascati manual was adopted in 2002, which changed the way some statistics were collected. The UNESCO data portal, http://stats.uis.unesco.org/unesco/tableviewer/document.aspx?ReportId=143, breaks up researchers in natural sciences, engineering, and medical vs other.
Estimates of science spend per head in a country comes from the GERD per capita of the UNESCO report, and assume a typical % of direct spending on research from government (GOVERD) from the OECD data in order to compare to this GERD.
- Total spend
Comparing spend in different countries (note log y-scale):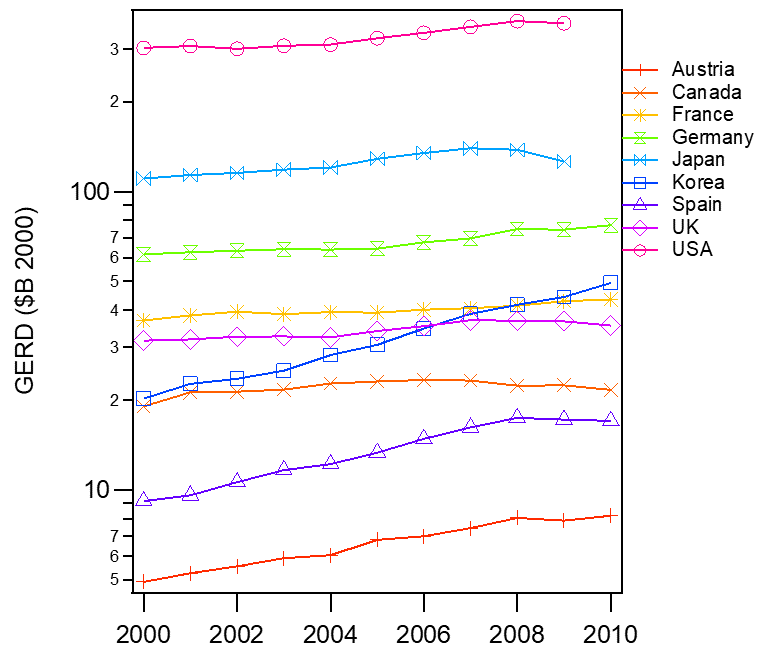 with a longer baseline for the UNESCO data
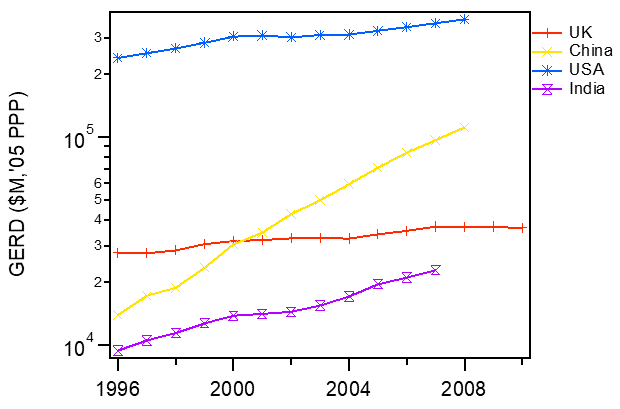 showing the consistent long term spending increases of China and (more slowly) India. This gross expenditure should be compared to the government contributions (GOVERD)
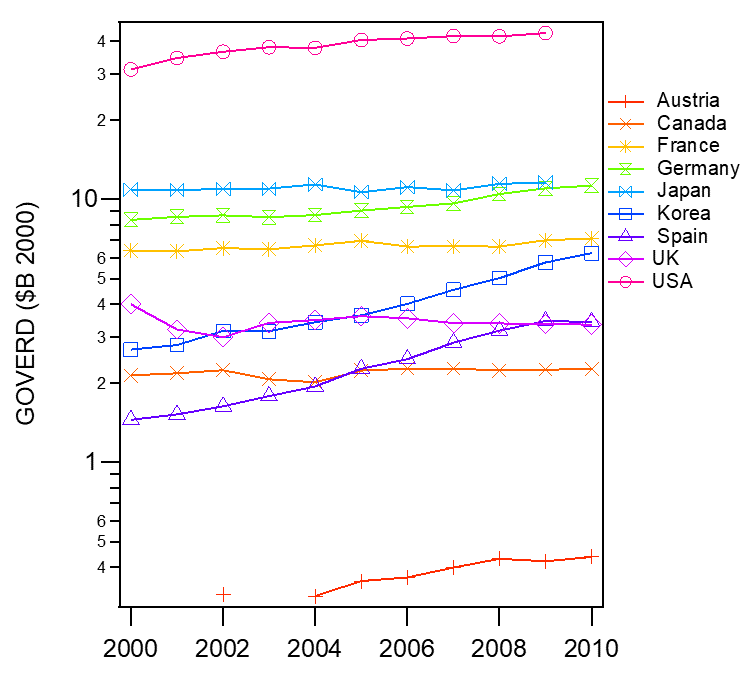 which is at least ten times smaller than the total R&D spend (compare y-axes to above).
- Spend per researcher
Using the numbers of researchers funded in government and higher education, it is then possible to calculate the total funding per researcher per year (in a normalised currency taking account of inflation)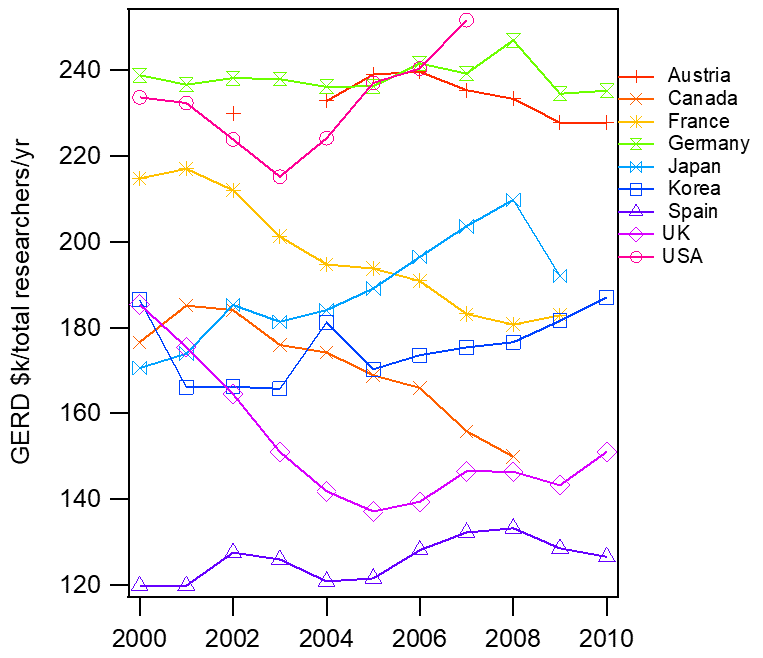 and the government funding per researcher per year
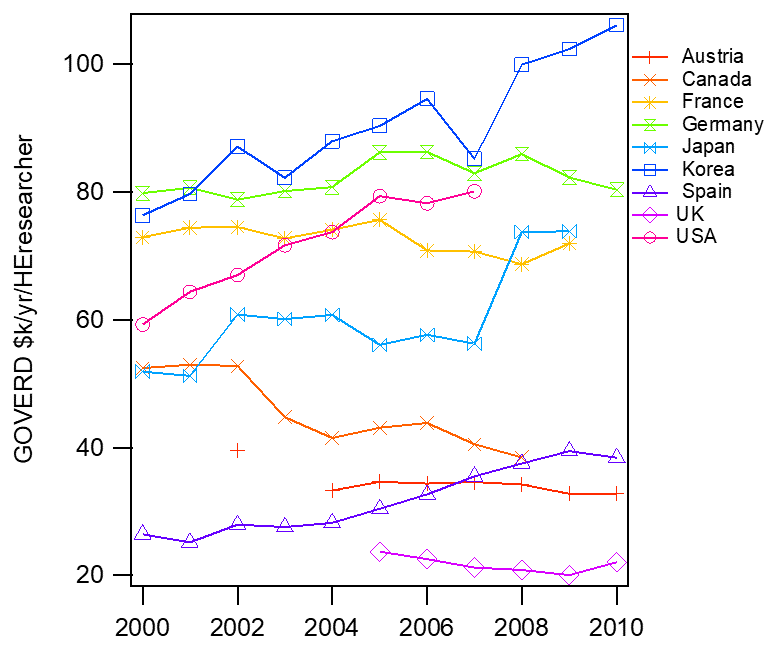 The latter shows a dramatic difference between the UK and other countries, with the USA being at the well-funded end, together with Korea. It is possible that the way different countries count funding in GOVERD differs, for instance in the underpinning of research institutes (like the Fraunhofer and Max-Plank Societies in Germany).
- Cost of administering and running grant competitions
There has been some work on the cost of administering grants and choosing which ones to fund. There is also the (much larger) cost of writing and submitting grants, which includes the people’s time and effort involved, both researchers and finance administrators.
Information about the UK [http://www.bbsrc.ac.uk/news/accounts/bbsrc-annual-15-16/ in the Finance Section] shows around 7% of grant value spent on administration, but that will include many things other than grant administration. An overarching report from 2006 [http://www.rcuk.ac.uk/documents/documents/rcukprreport-pdf/] by the RCUK, places the cost to a university of submitting a full proposal at around £10,000, while the cost to the administrating body is around £300 per submission.
I don’t know work comparing different countries but I have heard that some comparison exist.
- Are grant reviewers paid?
In the UK and Germany there is no remuneration for reviewing grants (though any travel expenses are reimbursed). In the USA the NSF pays a low rate (much lower than the salary rate).