- Journal Impact Factors
Apart from speciality journals that for instance list cancer studies, the journal impact factors for 2015 and excluding reviews (which are not primary science, but collect together the results of a field) are
source: InCites Thomson-ReutersJournal impact factor Lancet 44 Nature Biotechnology 43 Nature Materials 39 Nature 38 J. American Medical Association 38 Nature Nanotechnology 35 Science 35 Nature Genetics 32 Nature Photonics 31 Nature Medicine 30
Nature has a journal citation factor of 38 in 2015, and it slowly increased from 27 in 1997.Endless discussions of h-factors, often concentrate on their inflation, see for instance http://wwwalt.phil-fak.uni-duesseldorf.de/infowiss/admin/public_dateien/files/1/1252916449inflation_.pdf.
- Profit margin of scientific journals
There are many discussion about profit margins of publishers of scientific journals. Obviously publishers do not release any of this information and it has caused great controversy.
See for instance http://mobile.reuters.com/article/idUSBRE85B0SH20120612.
Typical estimates are profit margins of 30%, which is one of the best in publishing of any sort.
In addition there are now very few major journal publishers, discouraging price competition, see for instance http://journals.plos.org/plosone/article?id=10.1371/journal.pone.0127502 and other discussions in http://www.monbiot.com/2011/08/29/the-lairds-of-learning/. See also discussions about their monopoly on the publishing market, http://journals.plos.org/plosone/article?id=10.1371/journal.pone.0127502.
- The current highest cited person is Bert Vogelstein, in 2016 with 293153 citations, http://www.webometrics.info/en/node/58.
When in h-index order, 1st is Sigmund Freud , 2nd is Graham Colditz.
When in citation number order: 1st is Michel Foucault with 664212, but the top living scientist is Bert Vogelstein.
- The average number of citations per paper in physical sciences or in biological sciences is estimated in a number of places.
https://www.timeshighereducation.com/news/citation-averages-2000-2010-by-fields-and-years/415643.article (2010).
For physical sciences, around 12 cites/paper varying from 15.5 for Physics to less for associated fields like engineering/comp.science. In biological sciences it is around 25 cites/paper, medicine 23, and much higher for fields like immunology or molecular biology.
Comparable data in http://csr.spbu.ru/wp-content/uploads/2010/09/aver_cit_fields.pdf uses numbers of papers as weighting, and setting ‘physical’ as physics, engineering, materials and compsci; ‘biological’ as medicine, biology, molecular biology, neuroscience, animals/plants, immunology, gives the citations per paper of physical sciences as 11 vs biological of 25.5, so broadly in agreement.
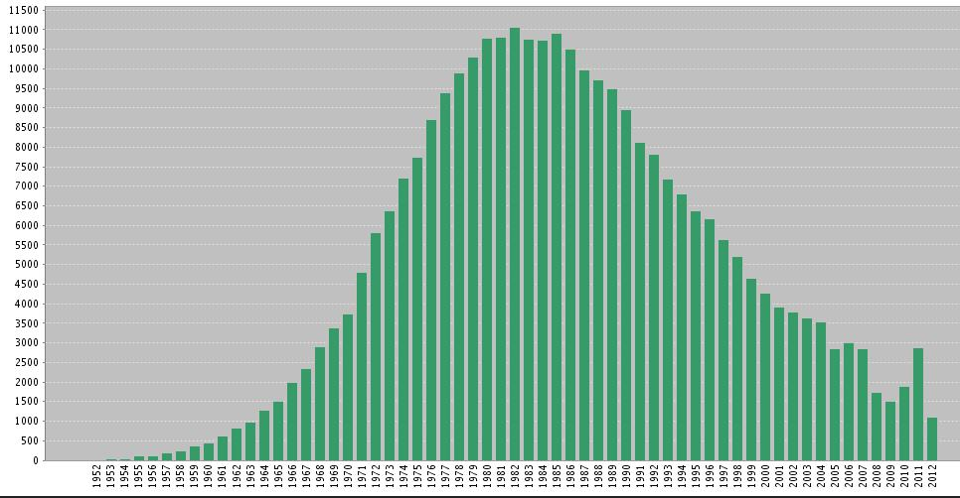
- The most cited paper of all time is by Oliver Lowry
Discussed in http://www.nature.com/news/the-top-100-papers-1.16224, it has 305148 (as of late 2014). Articles which describe basic scientific methods or statistical epidemiological data are often highly cited, as this article on protein quantity determination. Lowry himself later mentioned that this article is not the most important one he ever published. See also http://www.jbc.org/content/280/28/e25.full. This paper’s citation history is shown below from being published in 1951, and peaking in 1982 with 11k cites/yr.
 More discussions about the highest citated mundane papers, http://www.smh.com.au/articles/2003/10/09/1065676090723.html.
- Are referee’s suggestions useful?
The editor or Economic Inquiry writes about this experiment in forcing yes/no responses from referees, http://vita.mcafee.cc/PDF/EditorExperiences.pdf. All authors preferred to take into account suggestions of referees than not, even when given the choice. This would support the idea that despite aggrevations, peer review is rather effective in improving journal papers.
This discussion covers many experiences of being an editor of a journal.
- Uses of h-factors
There are large numbers of articles analysing in ever greater ways the h-factor distributions.
A nice discussion of the concepts and how to make it more portable across scientific fields is at http://arxiv.org/ftp/physics/papers/0607/0607224.pdf, which also shows why direct comparisons cannot work because of the different citations per paper in different disciplines.
- Distribution of citations
Much statistical analysis of how journal papers attract citations has been undertaken. The number of papers with x cites N(x) vs citation rank x over a large distribution of papers has a characteristic shape
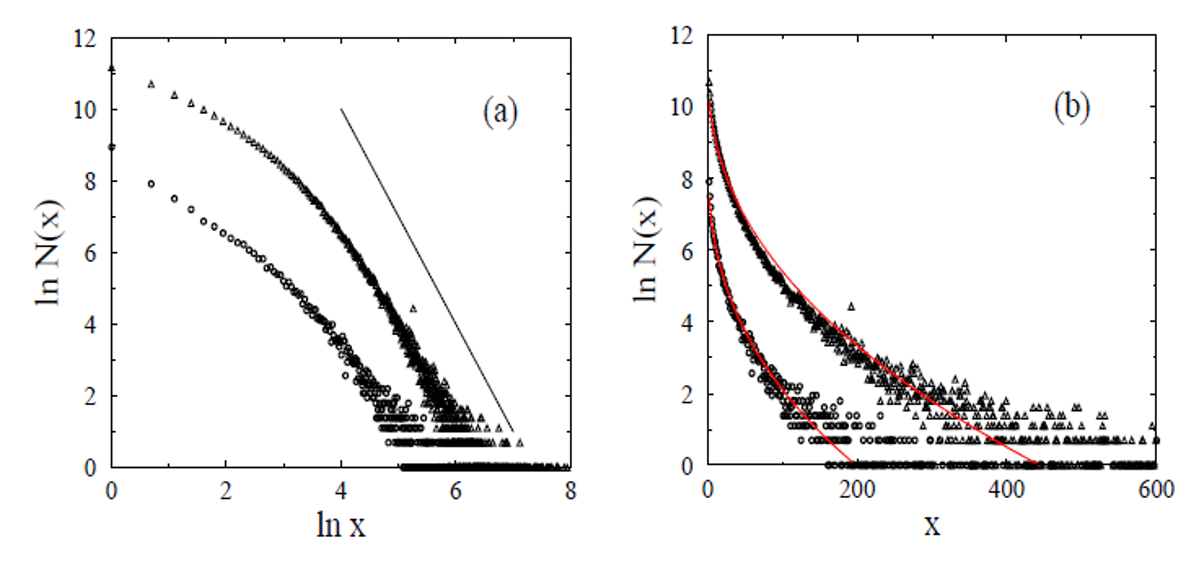 (from http://www.springerlink.com/content/h0bt0p17vqytuvxc/). This follows a form of Zipf’s law, which is thought to arise whenever preferential attachment operates: if others citing a paper increase the chance it is again cited. The distribution follows N(x) ∝ x-3 (black line).
- One can look also at the distribution of h-factors for different populations of scientists. For instance a typical looking distribution is for Finnish physicists (over all stages of their careers)
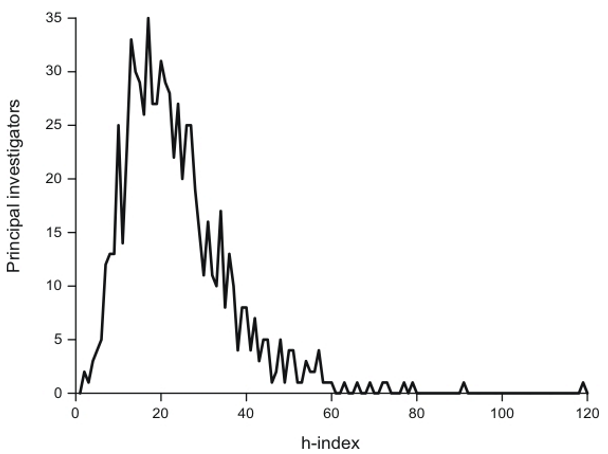 [from http://rna.uta.fi/CitationAnalysis/results_distribution.shtml]
This again shows the long tail of very few very-highly cited physicists.- There is a good correlation between the number of citations to a researchers and their h-factor, irrespective of which database the h-factor is calculated from, which follows a square root:
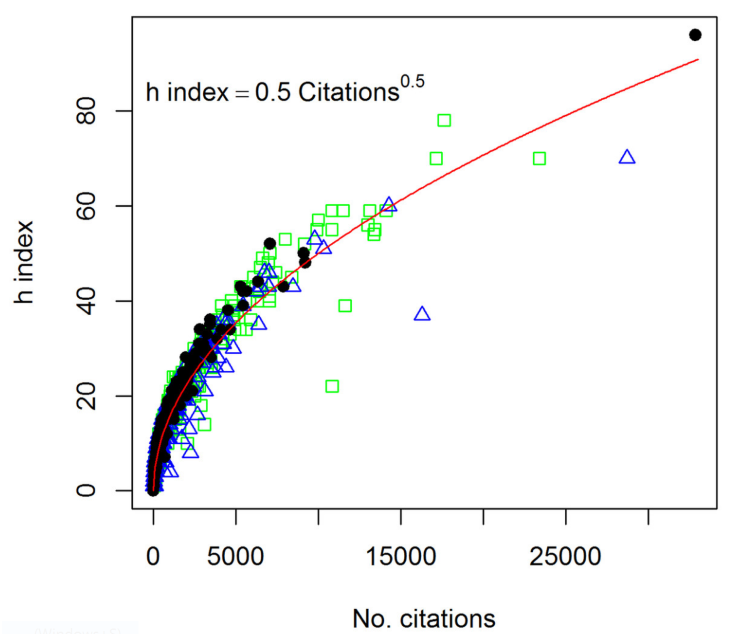 [for 340 soil researchers, Google Scholar/WebofScience/Scopus, http://peerj.com/articles/183/]
- Readership factors
Many more scientists read an article than cite it in one of their own papers. Introductory discussions on this can be found at: http://academia.stackexchange.com/questions/1206/how-many-people-read-an-individual-journal-article and http://www.johndcook.com/blog/2010/06/23/write-only-articles. For instance Nature has 424,000 total readers but the journal has a circulation of only around 53,000. Studies have concluded that on average a single copy is shared by as many as 8 people. The Nature website has 900,000 unique visits per month, and publishes around 200 articles per month, suggesting 4500 readers/article/month. PlosOne gets a ~800 views/article/yr. Both suggest that the number of views of a paper over its lifetime is 1000-4000.The ratio of downloads/citation is 50-200, but this depends on research field; eg Maths gets around 400 downloads/citation (mathematicians ruminate and read more?). Most journals show downloads correlate well to citations, eg Journal of Vision 2008, http://www.journalofvision.org/content/9/4/i.
- Citation distributions for individual scientists
Ranking the citations for the papers from individual scientists seems to give a universal curve, something like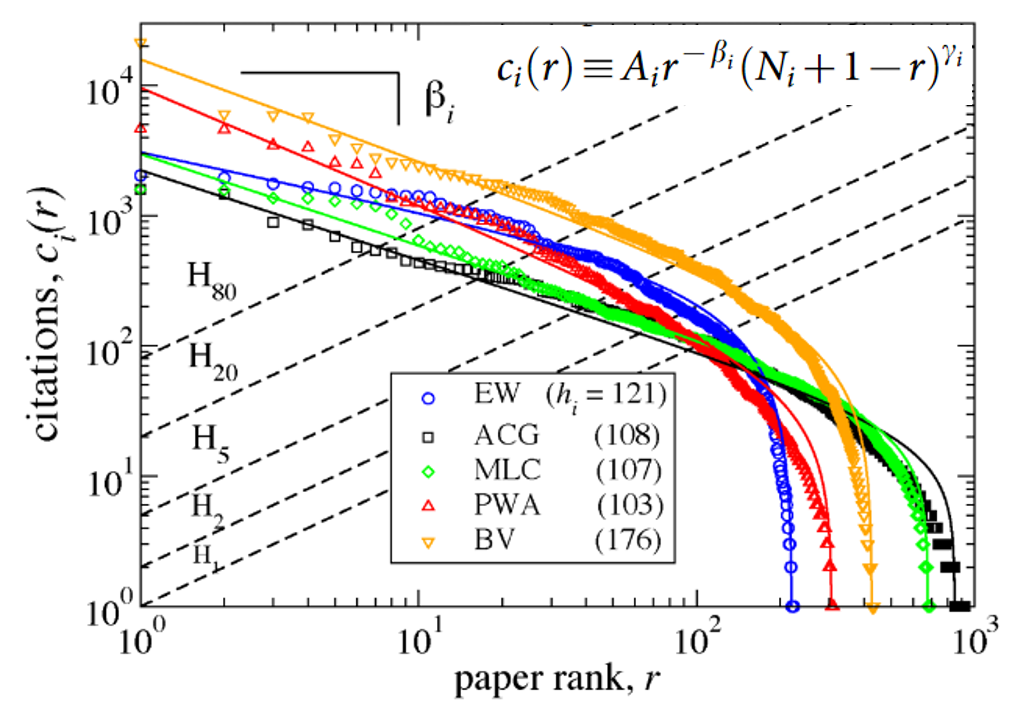 [from http://www.nature.com/srep/2011/111205/srep00181/pdf/srep00181.pdf]
where BV is Bert Vogelstein again, and the others shown here are prolific well-known scientists. The h-factor ( shown in brackets, given where H1 crosses points) gives some measure of the differences between these distributions, but shows how a single number is unable to capture the full distribution. These different distributions show that the citation-rank distribution is not `scale-invariant’: they cannot be simply scaled onto each other when accounting for different success or career stage. Instead the distributions generally follow a formula seen on the top right of this plot, where β is the exponential falloff of their highest impact papers (typical values of 0.5-1), Ni is the total number of papers they published, and γ shows the follow off for the very large number of forgotten papers at the low (large r) rank end.
These two exponents represent `heavy-weight’ papers and `newborn’ papers. There is a positive feedback operating so that increased heavyweights increase exposure of newborn papers. For very high impact scientists, β ~ 0.9, giving nearly 1/r for citations (or β=1) as found elsewhere in the social sciences and economics, which is known as Zipf’s law.
The growth rate in h per year varies between 1 and 3, and can be seen as a predictor of future achievement. There is discussion about whether career progression is then related to cumulative advantage in these citations, or a real difference in some scientists capabilities and strengths.
- Gini-indices
A good discussion of the Gini index can be found at http://www.scientificamerican.com/article/ask-gini/. There are various studies of citation distributions in different fields. For instance in evolutionary sciences, http://peerj.com/preprints/265.pdf shows the Gini index for the field is ~0.8 (very high) and 20% of scientists have more than 82% cites for ecology and conservation biology, and 83% for evolutionary biology. These are the most unequal fields in terms of some scientists dominating discourse and directions.There is evidence that higher impact journals have more equal Gini coefficients (generally all their work is well cited) [http://content.onlinejacc.org/article.aspx?articleid=2275687]. In Gini comparisons of total publications between different universities (using the Shanghai ranking http://arxiv.org/ftp/arxiv/papers/1001/1001.2921.pdf), it seems universities are not becoming more elite (ie. Gini inequality between universities is not increasing). There is no evidence that inequality between countries is increasing (so that the citing preference does not apply to countries), and the top 500 universities are losing ground to the next 500. Investing in high education unequivocally helps performance on the measure of citations and impact.
- What happens to poorly cited papers
Citations to any particular paper take about 3 years to kick in, and become stable after 10-15 years. A typical citation history (from Geological Sciences) looks like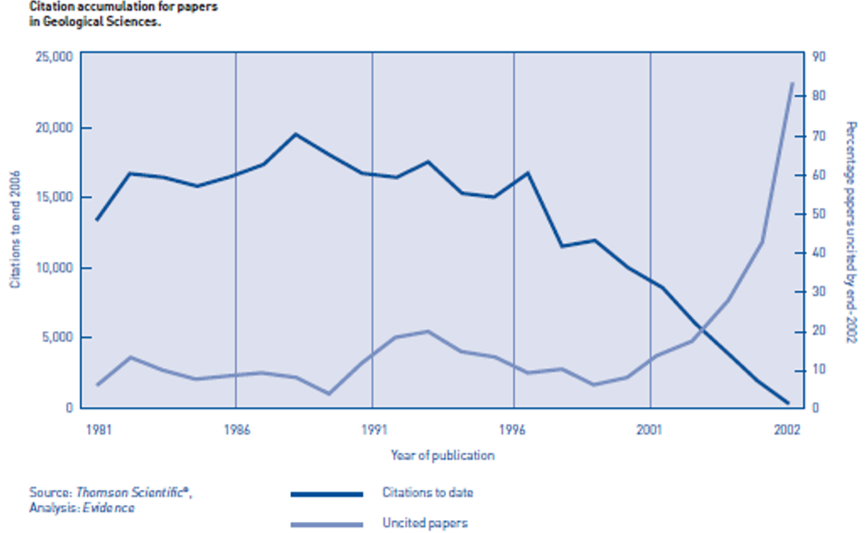 [http://www.universitiesuk.ac.uk/policy-and-analysis/]
One reason that some papers remain uncited (around 10% in geological sciences from this data) is that they can be provisional, wrong, or not currently of interest. Still, they may be read and cited later than 5 years for specialists. In a 2009 article in Online Information Review, Péter Jacsó found that 41% of articles published in the top science and social-science journals were cited in the period 2002 to 2006 [http://chronicle.com/article/We-Must-Stop-the-Avalanche-of/65890/].