- The number of full time academics in the UK can be extracted from the 2008 and 2014 research excellence framework (REF) data (previously called the Research Assessment Exercise, RAE). This gives the total number of UK academics in Science, Eng, Medicine as ~31,000. The contrasts with OECD/UNESCO figures which give a total for the number of UK researchers as 252,000, including those in industry and institutes.
The breakdown of researchers in universities in the UK is: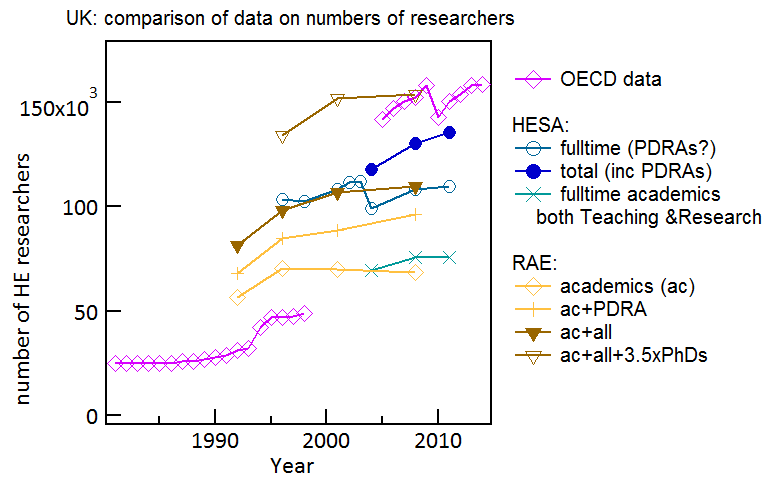
This graph (from data in rae-analysis) shows the clear difficulties of defining numbers of researchers within universities of higher education (from the Higher Education Statistics Agency, HESA). We first have to discriminate between all academics and scientists. Arts, humanities, and social scientists are a small fraction (see elsewhere) so this is not so problematic. Next we have to discriminate between full time academic researchers, and postdoctoral researchers (PDRAS, on temporary contracts), and PhD students. There are good arguments to include PDRAs since they are engaged typically full time in research. It is less clear whether to include PhD students depending on if you consider they are primarily being trained, or primarily doing research (which I favour). The number of full time academic staff is around 75k, fairly constant/gently rising in the past years. The RAE data here includes physical/biological/medical scientists and engineers. Because there is reporting in the RAE on the number of PhDs awarded per year, an estimate can be made for the total PhD student population, and thus the total number of researchers (‘ac+all+3.5xPhDs’). This seems then to match the OECD data for HE researchers. HESA data reporting also seems to have changed over time.
On average the number of PDRAs per academic is roughly 1, independent of the research area (from 0.7 in physical sciences to 1.2 in biological sciences). On average the number of PGs per academic is also roughly 1 independent of field (from 0.8 in medical sciences to 1.2 in the others).
- The Frascati definition states that postgraduate (PG, PhD) students should be considered as researchers. Likely the UK reporting to OECD was updated to include this after 2000, hence the jump in numbers.
- The number of full time academic faculty in the USA can be extracted from 2010 NSF data:
https://www.nsf.gov/statistics/seind14/index.cfm/chapter-5/c5h.htm#s4
75% of 360,000 Science&Eng doctorate holders (~270,000) have full time faculty positions.
The USA population in 2010 was 309 million, so this corresponds to 0.09% of the USA population. Corroborating OECD data is absent, but this matches the trend observed before 2000 (see next graph).
UNESCO data for 2010 gives the total number of researchers as 1.198 million, so S&E faculty in universities are 23% of this total (ie including industry).
- The number of researchers in higher education (HE, left graph) and industry and business (see right graph) has also been recorded in OECD statistics over a longer span:
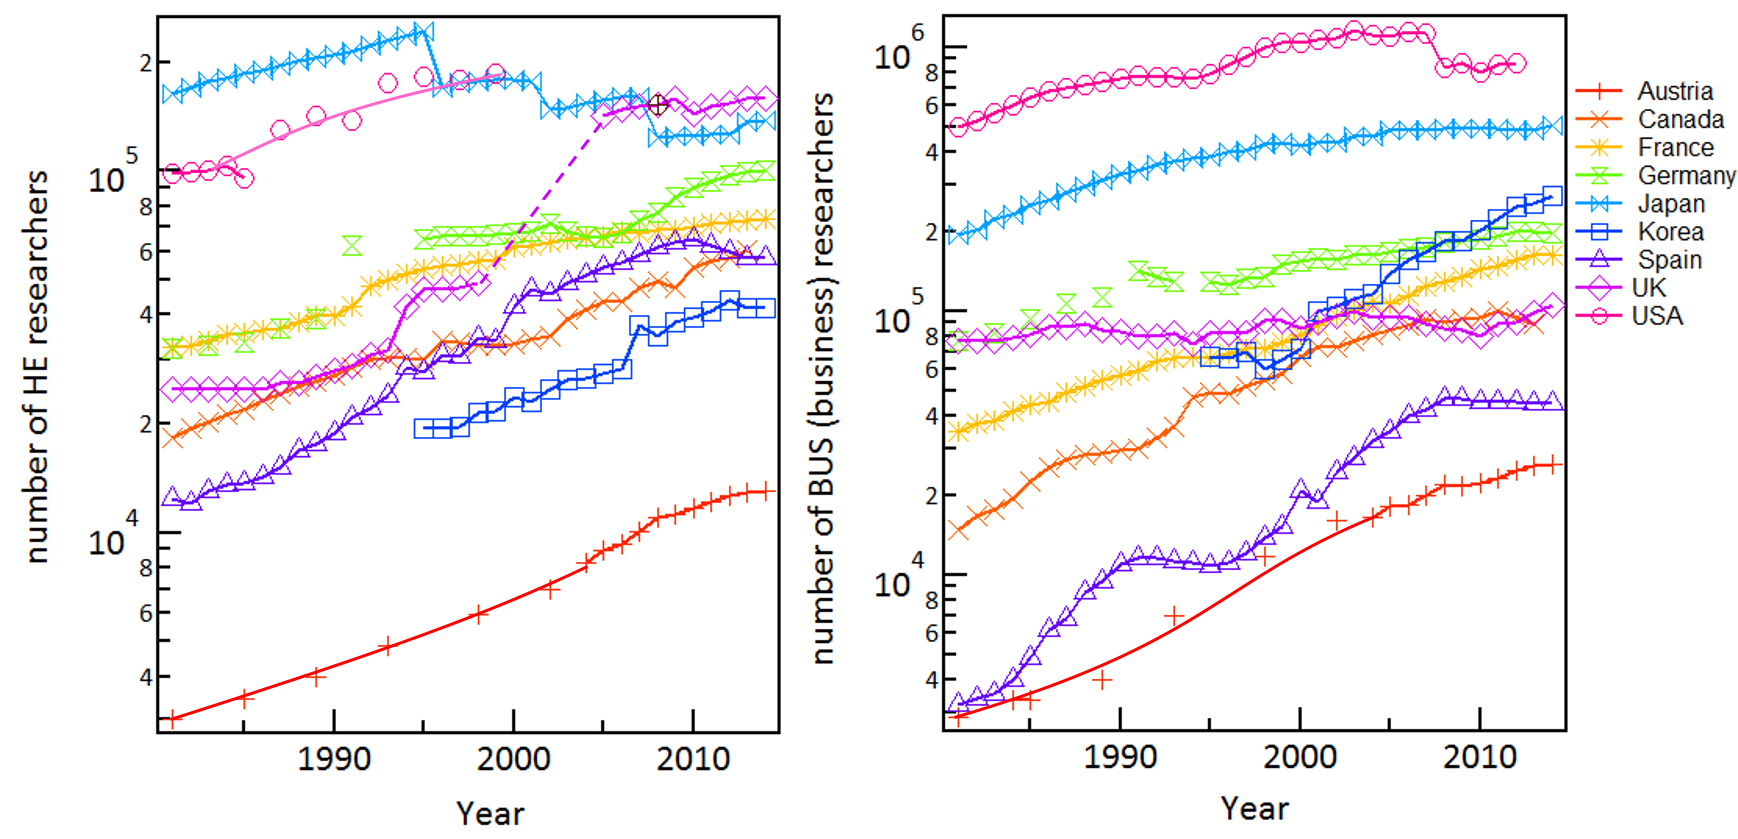 In some countries there have been larger rates of increase while both the USA and UK have been relatively stable, perhaps reflecting the balance between reductions in large company research labs counteracted by the growth of numbers of small high tech companies.
In some countries the number of industry researchers is five time larger than those in academic institutions (USA) while in others they are comparable (UK, Germany). It is not likely that countries use uniform methods to identify which R&D personnel in industry have a truly ‘research’ function.This data directly gives the % of researchers in universities or institutes (HE+GOV) compared to the total: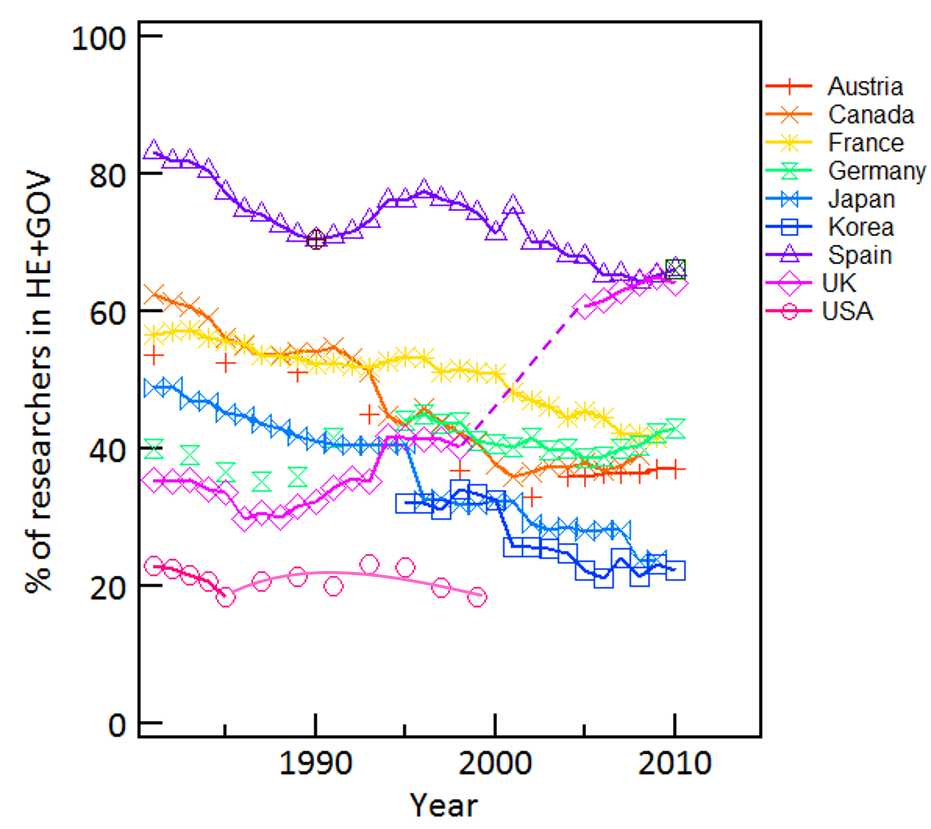 This shows more detailed trends than the histogram in the book. Generally the ‘GOV’ contribution is negligible in this fraction. The significant variation from 20-80% is related to structural configurations of academia and industry in different countries, but possibly confused by counting inconsistencies in different countries (exemplified by the UK adoption of Frascati definitions to include PhD students after 2000).
- The first detailed analytical summary I know of the implications of the rise in the number of scientists and research journals comes from Science Since Babylon by Derek da Solla Price in 1961.
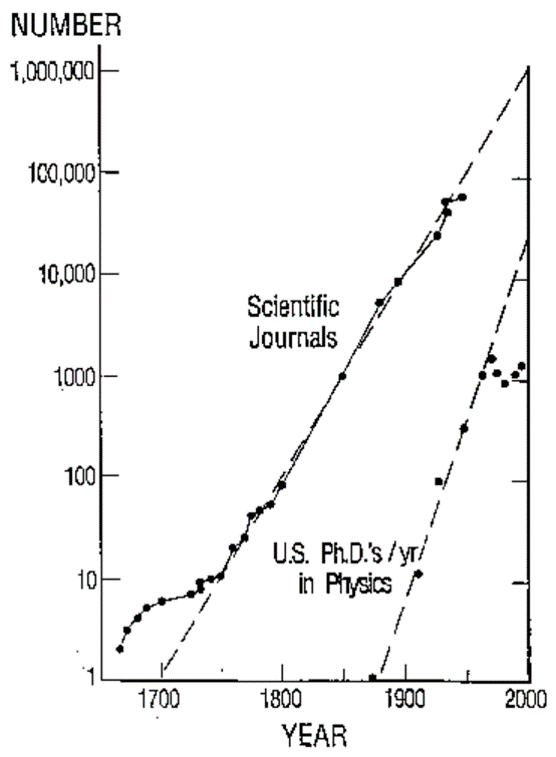 A nice additional summary of changes to this paradigm is found at http://www.its.caltech.edu/~dg/crunch_art.html which focuses on the changes since the 1970s.
- The % of the population who are PhD students varies widely in different countries
(data). For instance in some EU countries there are 5-fold variation:
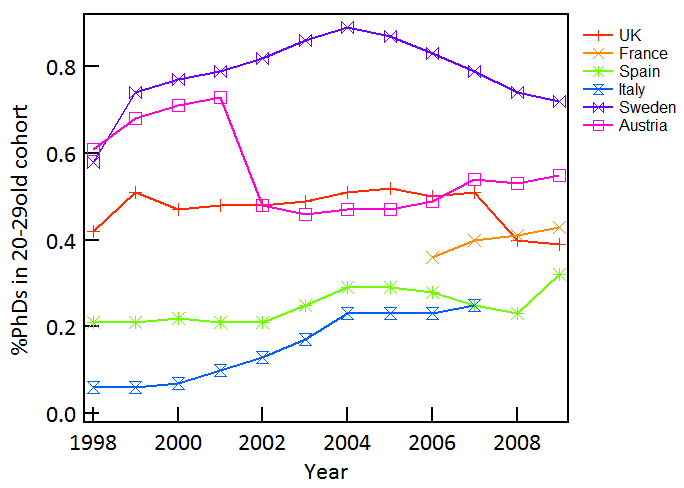 this is likely also due to different length of PhDs in different countries, as well as different pressure on completion rates. For instance in the UK, PhDs are shorter and funding has been reducing. On the other hand, many students from outside the UK or USA come to study PhDs there, inflating both the 20-29 cohort numbers as well as the % doing PhDs.
Perhaps it is also of interest that the % of PhD students in this cohort almost matches the % of scientists in the total population of each country.
- Another way to view the size of different disciplines in science is through membership of learned societies. These include almost all academics and professional scientists in their home country, as well as some fraction of postdocs and graduate students. They also attract membership partly from beyond their borders. Rough numbers for 2012 are
UK: Institute of Physics: 40000
USA: American Physical Society: 50000+ members (22% outside US, info)
USA: American Chemical Society: 164000
USA: Materials Research Society: 16000
Germany: Physics society (Deutsche Physikalische Gesellschaft): 61000
USA: Institute of Electrical and Electronics Engineers (IEEE): 400000 (49% outside US)
UK: Institution of Engineering and Technology (IET): 153000 (EU)
USA: American Society for Biochemistry and Molecular Biology: 12000
USA: American Society for Microbiology: 43000 (33% outside US)
- In the UK, the balance between academics between different disciplines can be estimated from the RAE 2008 data (see above).
Total Staff FTE (A) FTE % fraction of science academics Physical 6,238 12% 25% Eng 5,922 11% 24% Biological 3,950 8% 16% Medical 8,480 16% 34%
This likely varies between different countries, and further data on this would be useful.